
How to debug the extension
How to enable debug mode and collect logs for troubleshooting
If an applet doesn’t run as it should, debug mode makes the extension write detailed logs, which help us find the problem.
Check the extension is working

Before turning on debug mode, check that the extension is running:
- Is the extension pinned? Make sure the extension is pinned to your browser’s toolbar.
- Is the extension enabled? Check your browser’s extensions page (
chrome://extensionsoredge://extensions) to confirm it is toggled on. - Is it turned on for the current website? Click the extension’s icon and make sure Enable for this domain is on.
- Is there an Applet and does it start? Make sure the webpage actually contains a Java Applet and that it attempts to load.
- Are there any Network errors? Open the browser’s developer tools and check the Network tab for failing requests.
If all of that is fine and the problem remains, ask us on Discord or open an issue on GitHub, with the logs from debug mode described below.
Turn on debug mode
To turn on debug mode:
-
Click the extension’s icon in the toolbar.
-
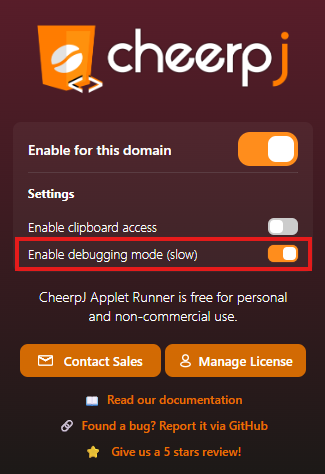
In the popup, turn on Enable debugging mode (slow).
-
The extension now uses the debug version of the CheerpJ runtime, which logs much more and runs more slowly.
Reload RequiredYou must enable the debugging mode before loading your application, or reload the page after enabling it. Otherwise, the setting will not take effect.
Collect the logs
We usually need two files: the console log and a network HAR file.
Step 1: Open Browser DevTools
To ensure we receive complete logs, you must either reload the page after opening the developer tools, or enable the extension only after the developer tools are open.
- Press
F12(Windows/Linux) orCmd + Opt + I(Mac) to open the DevTools. - Alternatively, right-click anywhere on the page and select Inspect.
Step 2: Save the Browser Console Output
- With the developer tools open, navigate to the Console tab. (If you don’t see it, click the
+symbol in Edge or>>in Chrome, then select Console). - If needed, trigger the error in your application.
- Right-click on any message in the console tab and select Save as…
- Save the console log to a file.
Step 3: Extract a HAR File
A HAR (HTTP Archive) file logs your browser’s network interactions and helps us diagnose loading or server responses.
- In the developer tools, navigate to the Network tab.
- Reload your page (or navigate to the applet) to ensure the network log captures requests from the very beginning.
- Trigger the error in your application if needed.
- Click the download icon (
↓) at the top right of the Network tab to export and save the HAR file.
Attach both files to your bug report on GitHub, or send them on Discord. Issues on GitHub are public, and logs and HAR files can contain internal addresses, cookies and other private data: for an internal or private applet, send them to appletrunner@leaningtech.com instead.